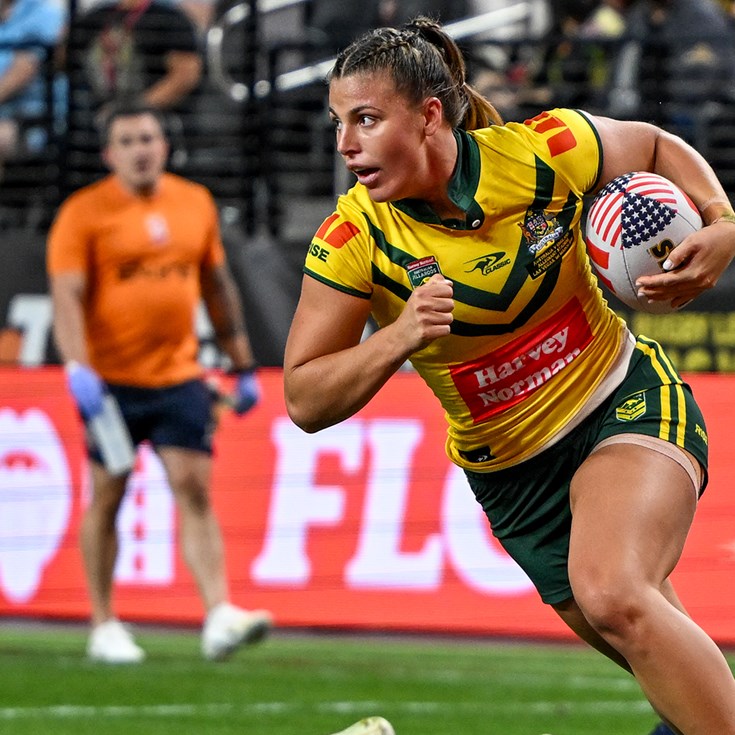
Jessica Sergis
Centre
Player Bio
- Height:
- 173 cm
- Date of Birth:
- 15 September 1997
- Weight:
- 75 kg
- Birthplace:
- Sydney, NSW
- Age:
- 28
- Nickname:
- Winx
- Debut Club:
- St. George Illawarra Dragons Women
- Date:
- 09 September 2018
- Opposition:
- Brisbane Broncos Women
- Round:
- 1
- Previous Club:
- St. George Illawarra Dragons Women
- Junior Club:
- Coogee-Randwick Wombats
- Biography:
A game-breaking centre with a high work rate, Jessica Sergis joined the Roosters in 2021 and played a key role in their maiden Premiership win. A proud Roosters fan since childhood, she has gone on to represent both New South Wales and Australia at the highest level and was the inaugural Dally M Medal winner in 2019. Sergis returned from injury in 2024 to help guide the Roosters to a second NRLW title, and continued her strong form in 2025, scoring tries in Games I and III of the State of Origin series.
Career
- Appearances
- 46
- Tries
- 28
2025 Season
- Appearances
- 13
Scoring
- Tries
- 8
Attack
- Try Assists
- 4
- Line Breaks
- 10
- Tackle Breaks
- 50
Passing
- Receipts
- 203
Defence
- Tackles Made
- 189
- Missed Tackles
- 25
- Tackle Efficiency
-
Running Metres
- Average Running Metres
- 125
- Total Running Metres
- 1631
Fantasy
- Total Points
- 535
- Average Points
- 41.2
2025 Season - By Round
| Round | Opponent | Score | Position | Minutes Played | Tries | Goals | 1 Point Field Goals | 2 Point Field Goals | Points | Kicking Metres | Try Assists | Linebreaks | Tackle Breaks | Post Contact Metres | Offloads | Receipts | Tackles Made | Missed Tackles | Total Running Metres | Hit Up Running Metres | Kick Return Metres | |
|---|---|---|---|---|---|---|---|---|---|---|---|---|---|---|---|---|---|---|---|---|---|---|
| 1 | Warriors | Won | 30 - 6 | Centre | 70 | - | - | - | - | - | 26 | - | 1 | 3 | 49 | 2 | 20 | 6 | - | 141 | - | 10 |
| 2 | Dragons | Won | 10 - 24 | Centre | 70 | - | - | - | - | - | - | - | - | 5 | 44 | - | 11 | 15 | 1 | 85 | - | 11 |
| 3 | Broncos | Won | 26 - 30 | Centre | 67 | - | - | - | - | - | - | 1 | - | - | 58 | - | 19 | 9 | 1 | 147 | 12 | - |
| 4 | Bulldogs | Won | 42 - 22 | Centre | 70 | - | - | - | - | - | - | - | - | 4 | 30 | - | 11 | 6 | 2 | 63 | - | - |
| 5 | Wests Tigers | Won | 4 - 34 | Centre | 70 | 2 | - | - | - | 8 | - | - | 2 | 4 | 54 | - | 21 | 24 | 1 | 154 | - | - |
| 6 | Titans | Won | 8 - 24 | Centre | 70 | 1 | - | - | - | 4 | - | 1 | 1 | 2 | 52 | - | 14 | 13 | 4 | 91 | - | - |
| 7 | Knights | Won | 30 - 14 | Centre | 70 | - | - | - | - | - | - | - | - | 8 | 47 | - | 16 | 17 | 2 | 133 | 14 | - |
| 8 | Eels | Won | 12 - 56 | Centre | 70 | 2 | - | - | - | 8 | - | - | 1 | 5 | 70 | - | 15 | 16 | - | 170 | - | 7 |
| 9 | Cowboys | Won | 0 - 30 | Centre | 70 | 2 | - | - | - | 8 | - | - | 3 | 7 | 53 | 2 | 22 | 8 | 1 | 189 | 21 | - |
| 10 | Raiders | Won | 26 - 14 | Centre | 70 | 1 | - | - | - | 4 | - | - | 1 | 5 | 41 | 1 | 13 | 18 | - | 108 | 16 | - |
| 11 | Sharks | Won | 40 - 10 | Centre | 70 | - | - | - | - | - | - | 1 | - | 2 | 37 | 2 | 10 | 18 | 3 | 88 | 11 | - |
| 13 | Sharks | Won | 17 - 16 | Centre | 70 | - | - | - | - | - | - | - | - | 4 | 62 | 1 | 16 | 20 | 3 | 122 | 9 | - |
| 14 | Broncos | Lost | 18 - 22 | Centre | 70 | - | - | - | - | - | - | 1 | 1 | 1 | 43 | - | 15 | 19 | 7 | 135 | 5 | - |
Career By Season
| Year | Played | Won | Lost | Drawn | Win % | Tries | Goals | 1 Point Field Goals | 2 Point Field Goals | Points | Kicking Metres | Kicking Metres Average | Goal Conversion Rate | Try Assists | Linebreaks | Receipts | Tackles Made | Missed Tackles | Tackle Efficiency | Total Running Metres | Average Running Metres | Kick Return Metres | Total Points | Average Points | |
|---|---|---|---|---|---|---|---|---|---|---|---|---|---|---|---|---|---|---|---|---|---|---|---|---|---|
| Dragons | 2018 | 3 | 1 | 2 | - | 33% | 1 | - | - | - | 4 | - | - | - | - | 1 | 25 | 30 | 8 | 78.95% | 161 | 53.00 | - | 70 | 23.3 |
| Dragons | 2019 | 4 | 2 | 2 | - | 50% | 3 | - | - | - | 12 | - | - | - | 1 | 1 | 45 | 29 | 7 | 80.56% | 476 | 119.00 | 17 | 143 | 35.8 |
| Dragons | 2020 | 3 | - | 3 | - | - | 1 | - | - | - | 4 | - | - | - | - | 1 | 45 | 21 | 11 | 65.63% | 352 | 117.00 | - | 66 | 22.0 |
| Roosters | 2021 | 6 | 3 | 3 | - | 50% | 1 | - | - | - | 4 | 29 | 4.77 | - | 1 | 5 | 74 | 65 | 9 | 87.84% | 621 | 103.00 | 32 | 194 | 32.3 |
| Roosters | 2022 | 6 | 5 | 1 | - | 83% | 2 | - | - | - | 8 | 8 | 1.27 | - | 1 | 4 | 74 | 75 | 15 | 83.33% | 681 | 113.00 | 12 | 288 | 48.0 |
| Roosters | 2023 | 6 | 6 | - | - | 100% | 7 | - | - | - | 28 | - | - | - | 5 | 9 | 85 | 68 | 18 | 79.07% | 795 | 132.00 | 21 | 324 | 54.0 |
| Roosters | 2024 | 5 | 4 | 1 | - | 80% | 5 | - | - | - | 20 | - | - | - | 2 | 3 | 63 | 82 | 12 | 87.23% | 734 | 146.00 | 17 | 254 | 50.8 |
| Roosters | 2025 | 13 | 12 | 1 | - | 92% | 8 | - | - | - | 32 | 26 | 2.02 | - | 4 | 10 | 203 | 189 | 25 | 88.32% | 1,631 | 125.00 | 29 | 535 | 41.2 |
Career Overall
| Year Start | Year End | Played | Won | Lost | Drawn | Win % | Tries | Goals | 1 Point Field Goals | 2 Point Field Goals | Points | Kicking Metres | Kicking Metres Average | Goal Conversion Rate | Try Assists | Linebreaks | Receipts | Tackles Made | Missed Tackles | Tackle Efficiency | Total Running Metres | Average Running Metres | Kick Return Metres | Total Points | Average Points | |
|---|---|---|---|---|---|---|---|---|---|---|---|---|---|---|---|---|---|---|---|---|---|---|---|---|---|---|
| Dragons | 2018 | 2020 | 10 | 3 | 7 | - | 30% | 5 | - | - | - | 20 | - | - | - | 1 | 3 | 115 | 80 | 26 | 75.47% | 991 | 99.00 | 17 | 279 | 27.9 |
| Roosters | 2022 | 2025 | 36 | 30 | 6 | - | 83% | 23 | - | - | - | 92 | 62 | 1.74 | - | 13 | 31 | 499 | 479 | 79 | 85.84% | 4,464 | 124.00 | 113 | 1,595 | 44.3 |
Latest
Team Mates


Sydney Roosters respect and honour the Traditional Custodians of the land and pay our respects to their Elders past, present and future. We acknowledge the stories, traditions and living cultures of Aboriginal and Torres Strait Islander peoples on the lands we meet, gather and play on.